GitHub
Tableau

Github and Tableau Integration

Seamlessly connect your GitHub repositories with Tableau to unlock powerful data visualization and insights from your development workflows.

Explore Triggers and Actions

New Issue Comment
Trigger new event when a new comment is added to an issue or pull request
Project Item Status Changed
Trigger new event when a project item is tagged with a specific status. Currently supports Organization Projects only.
New Label
Trigger new event when a new label is created
New or Updated Milestone
Trigger new event when a milestone is created or updated
New Mention
Trigger new event when you are @mentioned in a new commit, comment, issue or pull request.
New Notification
Trigger new event when the authenticated user receives a new notification.
New or Updated Pull Request
Trigger new event when a pull request is opened or updated
New Organization
Trigger new event when the authenticated user is added to a new organization.
New release
Trigger new event when a new release is created
Create Project
Creates a project on the specified site. You can also create project hierarchies by creating a project under the specified parent project on the site.
Download PDF
Downloads images of the sheets of a workbook as a PDF file.
Query Projects
Returns a list of projects on the specified site.

How it works

Add your support channel as a trigger
Start with any customer-facing channel — WhatsApp, Email, Web Chat, or even Phone. When a new ticket, message, or call comes in, the workflow kicks off.
Connect your apps
Set conditions like agent persona, customer type, query intent, or urgency. Then let your AI agent auto-respond, triage, summarize, or even escalate — just using natural language.
Connect it to your tools
Sync with your CRM, Helpdesk, or internal systems. Automatically log tickets, update statuses, notify agents, send surveys or send summaries — your workflow, your way.

Popular App Usecases

No usecase found. Try searching again.

What can Ayudo do with Github and Tableau?

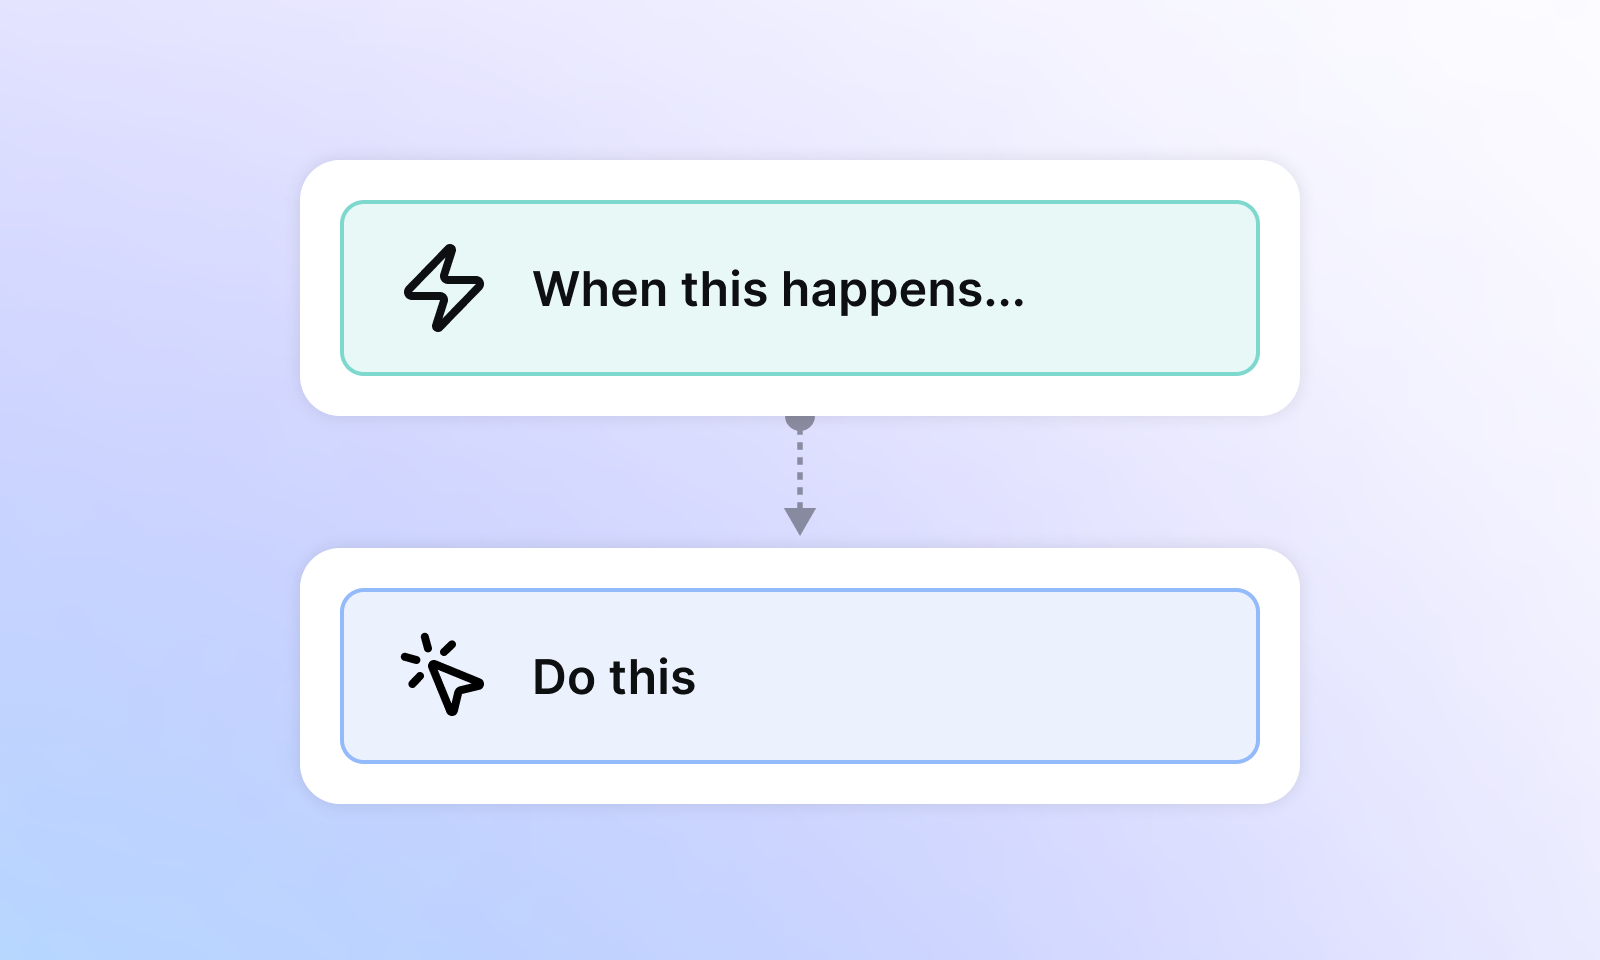
The GitHub and Tableau integration empowers teams to transform their code repository data into dynamic, interactive dashboards. By linking GitHub's rich development metrics with Tableau's advanced analytics, you can monitor project progress, track issue resolution, and analyze commit patterns—all in real time. This integration streamlines decision-making and enhances collaboration by providing clear visibility into your software development lifecycle through intuitive visualizations.

Connect
GitHub
and
Tableau
to streamline your company's workflows, automate tasks, and boost productivity.

Frequently asked questions

What data from GitHub can I visualize in Tableau?

You can visualize a wide range of GitHub data including commits, pull requests, issues, branches, contributors, and repository activity. This enables comprehensive insights into your development process.

How do I connect my GitHub account to Tableau?

Simply authenticate your GitHub account within Tableau using OAuth. Once connected, you can select repositories and data points to import and start building your dashboards immediately.

Can I automate data refreshes between GitHub and Tableau?

Yes, the integration supports scheduled data refreshes to ensure your Tableau dashboards always reflect the latest GitHub activity without manual intervention.

Is my GitHub data secure when integrated with Tableau?

Absolutely. The integration uses secure authentication protocols and adheres to industry best practices to protect your data privacy and security at all times.

Can I customize the visualizations created from GitHub data in Tableau?

Yes, Tableau offers extensive customization options allowing you to tailor charts, graphs, and dashboards to meet your specific analytical needs and preferences.

Built by folks who built