Procore
Tableau


Procore and Tableau Integration
Seamlessly connect Procore’s construction management data with Tableau’s powerful analytics to unlock deeper project insights.
Seamlessly connect Procore’s construction management data with Tableau’s powerful analytics to unlock deeper project insights.
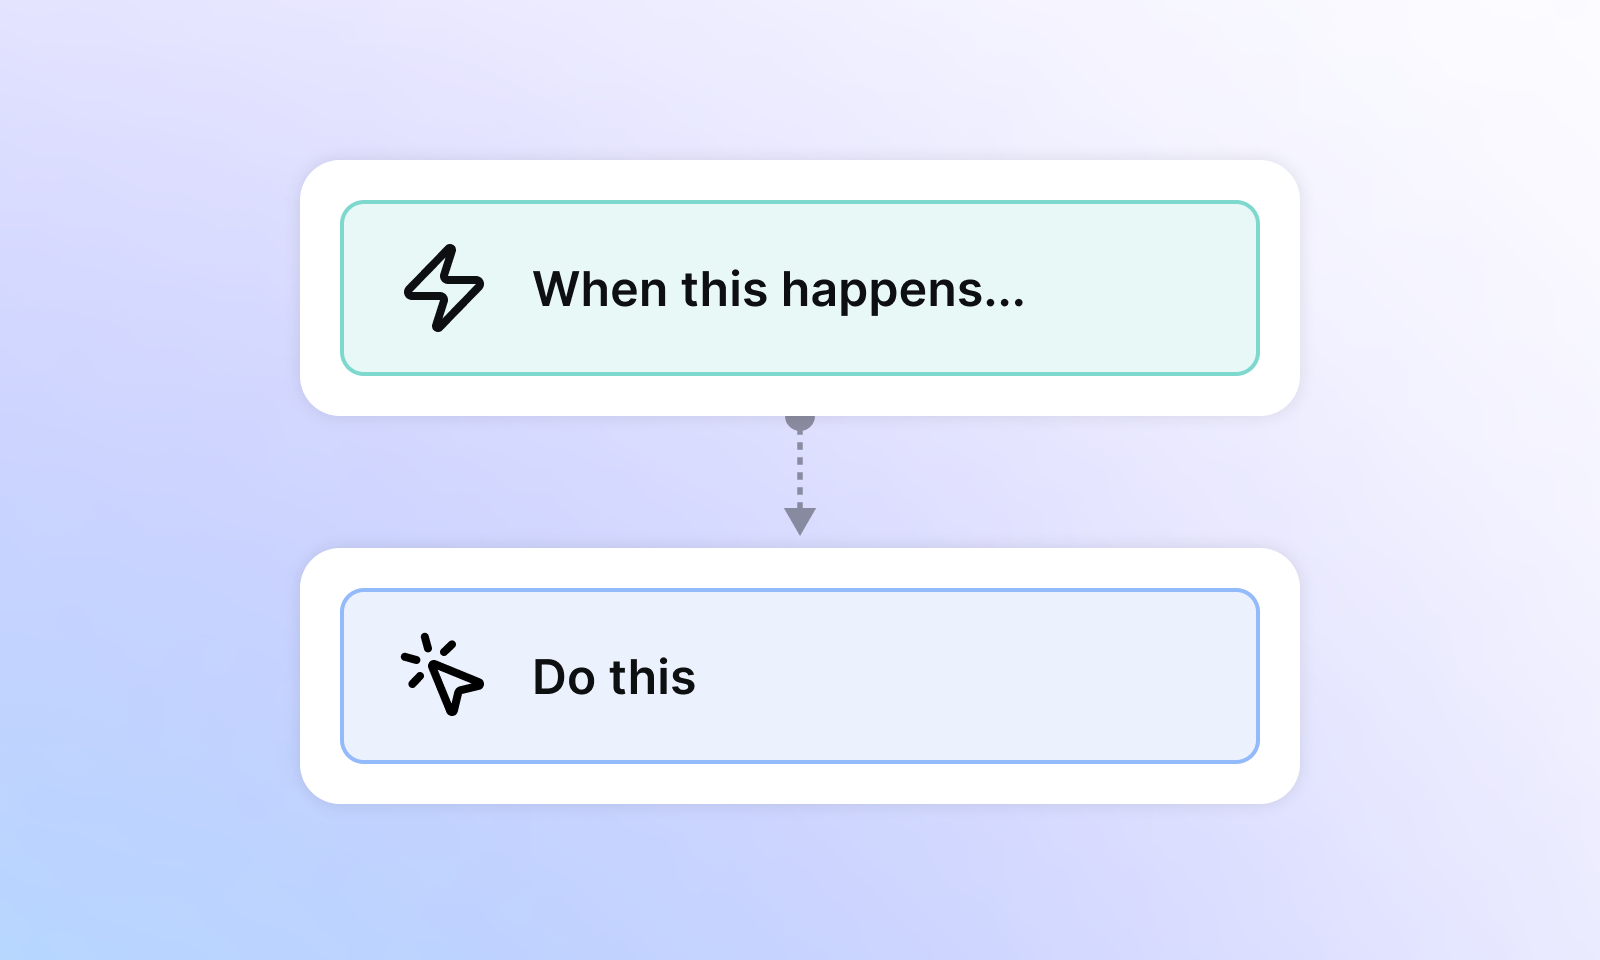
The Procore and Tableau integration empowers construction teams to visualize and analyze project data effortlessly. By syncing Procore’s comprehensive construction management platform with Tableau’s advanced data visualization tools, users can create dynamic dashboards, track key performance indicators, and make data-driven decisions that enhance project efficiency and outcomes.
You can visualize a wide range of Procore data in Tableau, including project budgets, schedules, RFIs, submittals, change orders, and labor productivity metrics, enabling comprehensive project analysis.
The integration connects Procore’s API with Tableau’s data connectors, allowing automatic data synchronization. This ensures your Tableau dashboards reflect real-time or scheduled updates from your Procore projects.
No advanced technical skills are necessary. The integration features a user-friendly setup process with guided steps, but access to Procore API credentials and Tableau is required.
Absolutely. Tableau’s flexible visualization tools let you tailor dashboards to your specific project needs, combining Procore data with other sources for holistic insights.
Yes, by providing real-time, visual insights into project performance, the integration helps stakeholders identify risks early, optimize resource allocation, and drive better project outcomes.